Annotations
Annotations allow you to mark specific dates on your analytics charts with notes. This is useful for tracking how real-world events—like a new marketing campaign, a product launch, or a server outage—correlate with changes in your traffic or performance data.
Creating an annotation
You can create an annotation directly from any time-series chart on your dashboard.
- Navigate to your project's dashboard.
- Right-click on the specific date point on the chart where you want to add a note.
- Select Add annotation from the context menu.
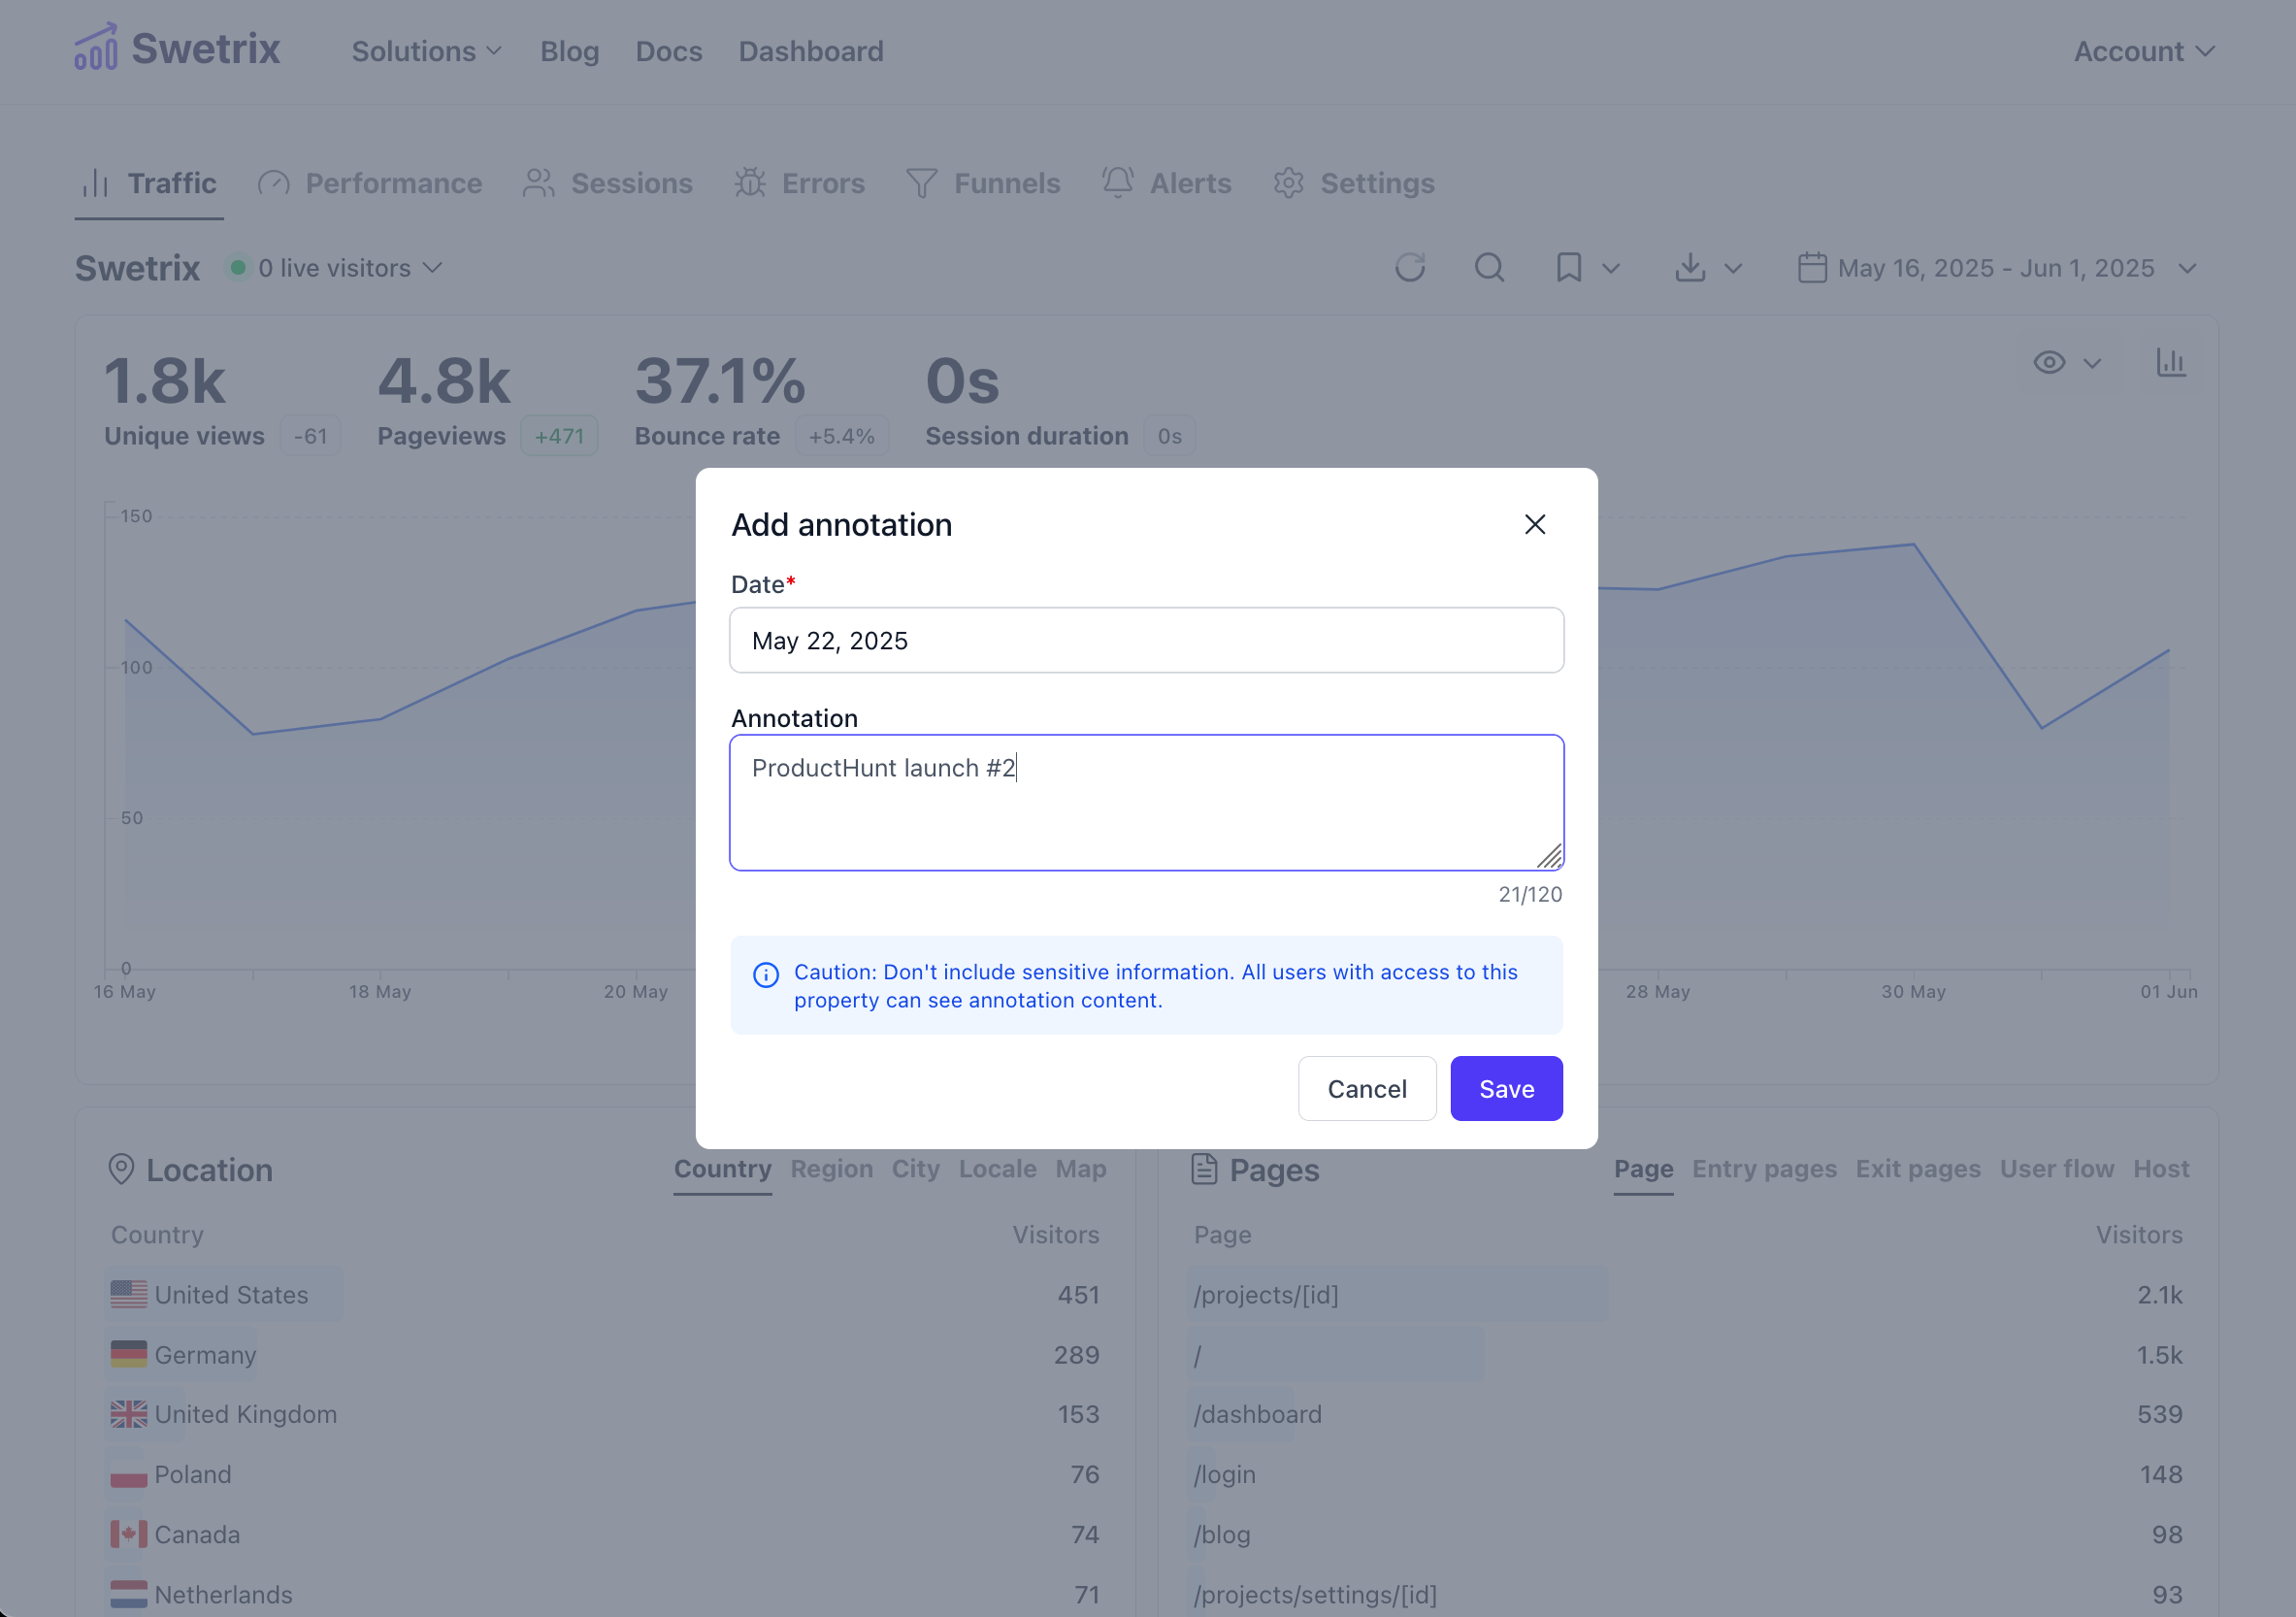
A modal will appear where you can enter the details:
- Date: The date for the annotation (pre-filled based on where you clicked).
- Note: A short description of the event (max 120 characters).
Click Save to create the annotation.
Note: Please avoid including sensitive personal information in annotations, as they may be visible to other team members with access to the project.
Managing annotations
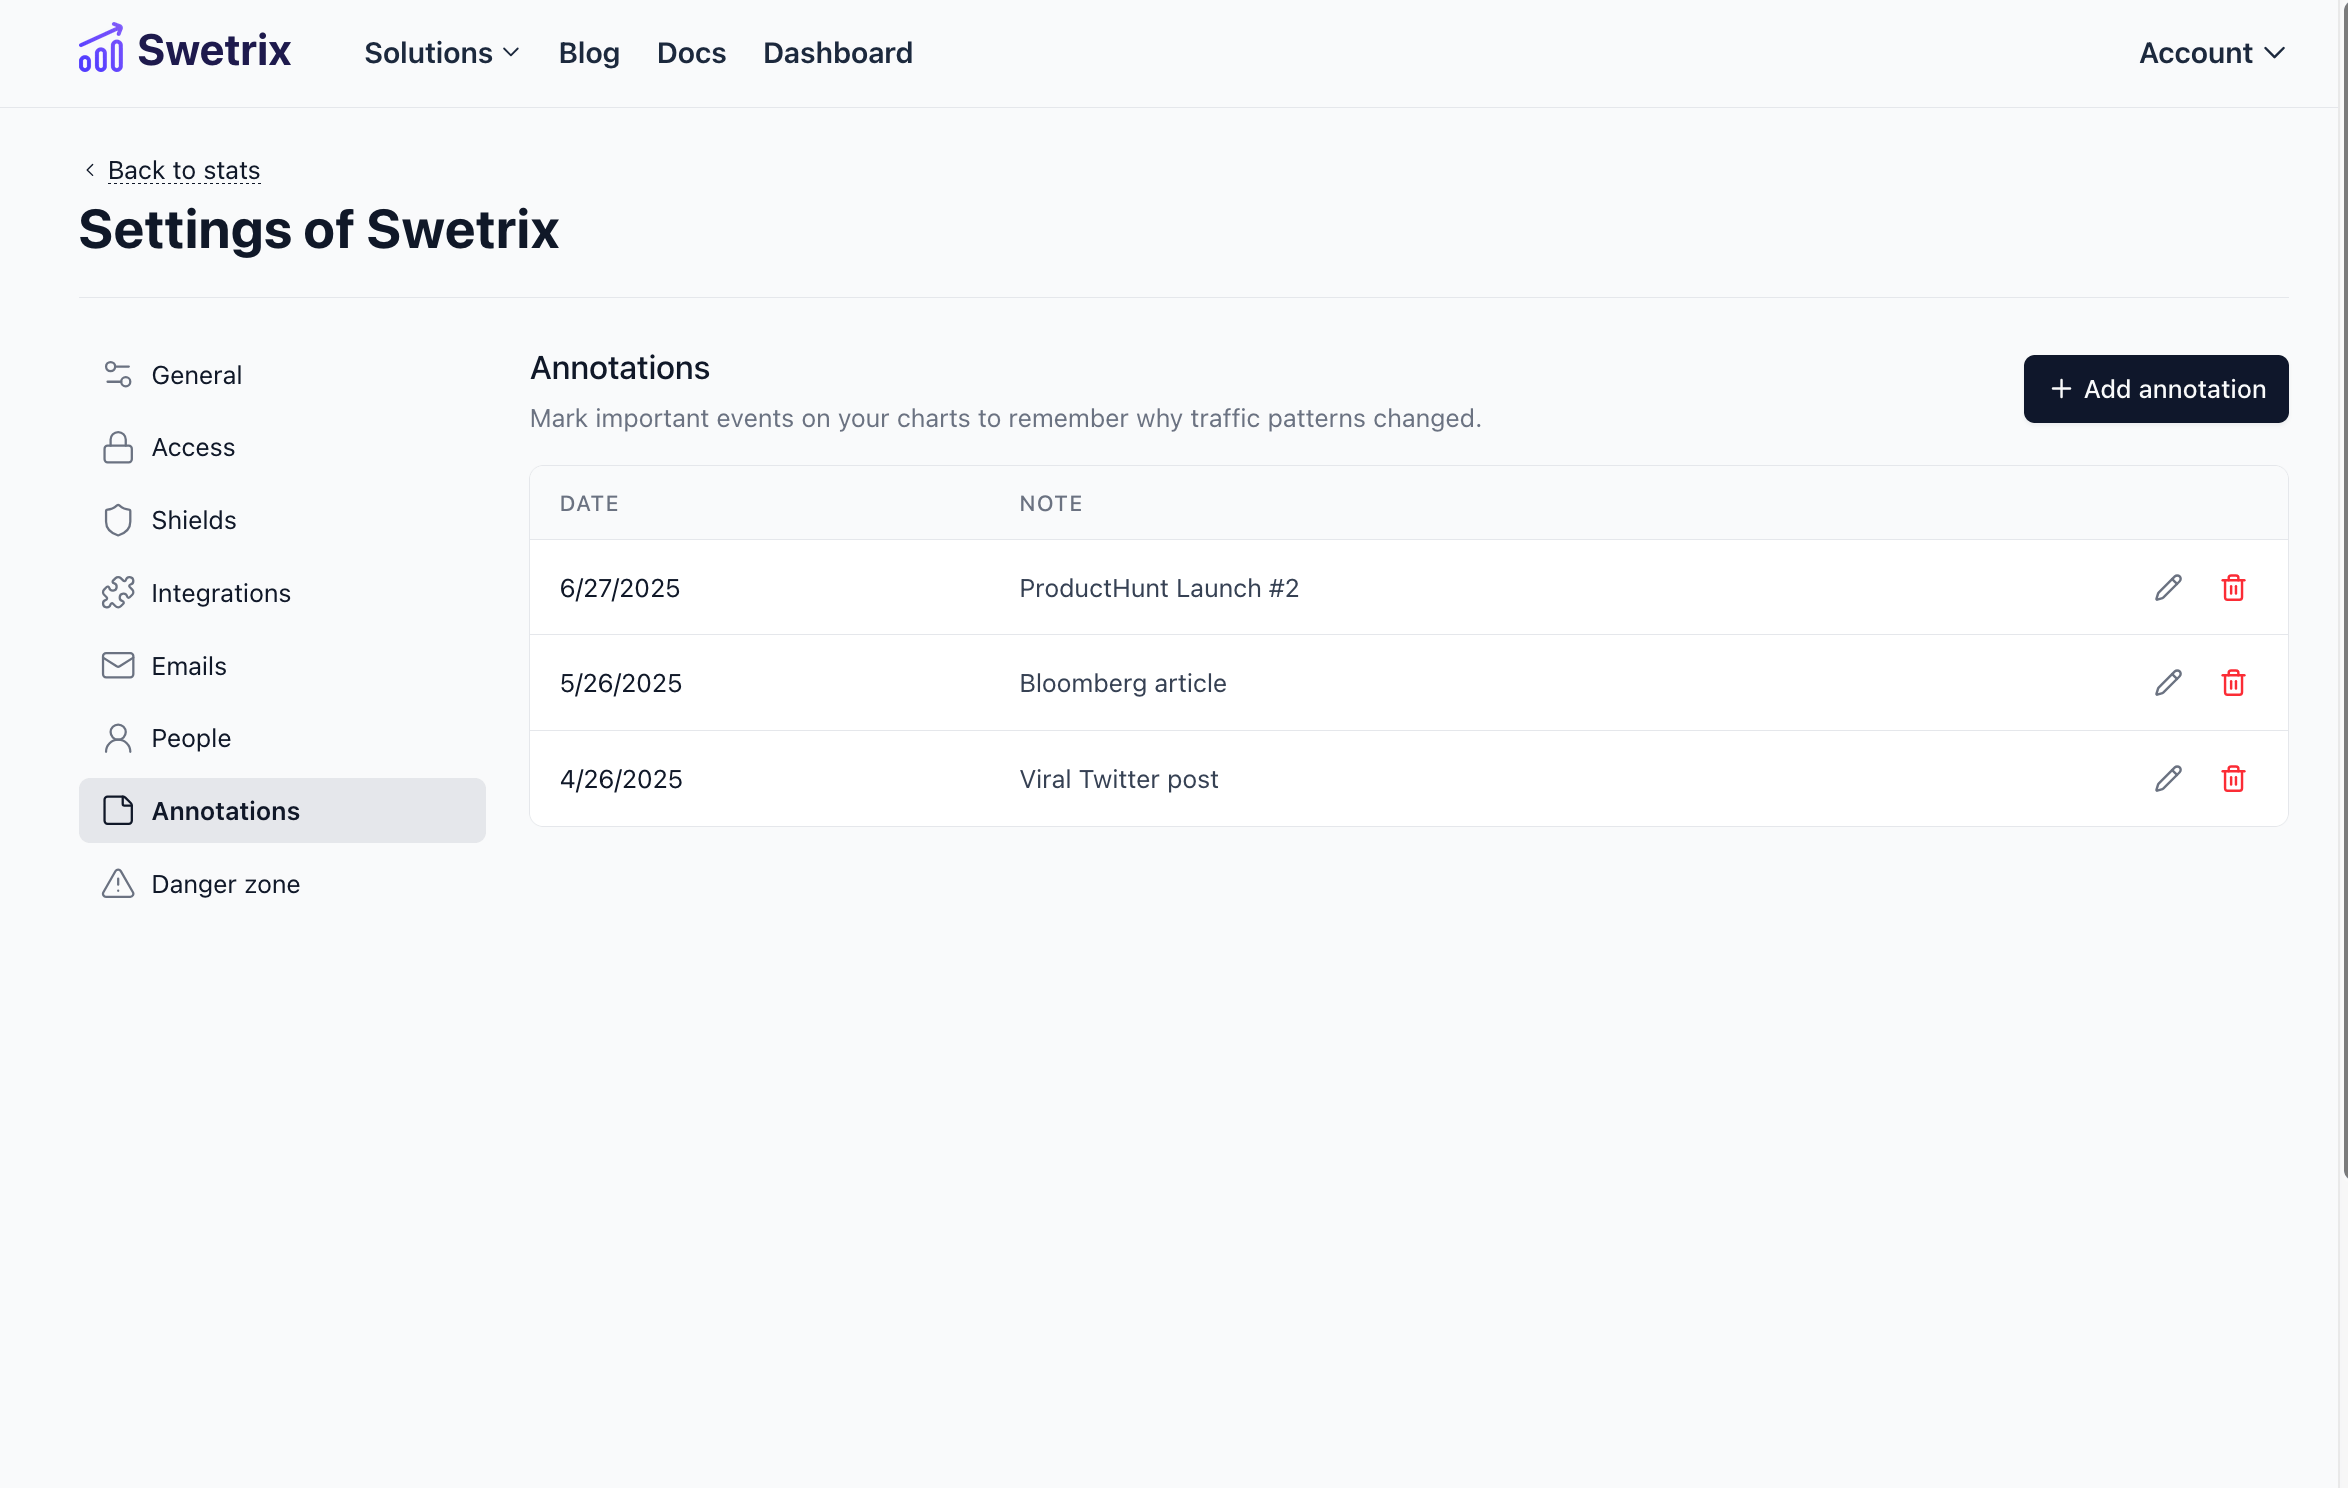
You can view, edit, and delete all annotations for a project from the settings page.
- Go to your project settings.
- Navigate to the Annotations tab.
Here you will see a list of all annotations created for this project, sorted by date.
Editing an annotation
To edit an existing annotation:
- Find the annotation in the list.
- Click the Edit (pencil) icon.
- Update the date or text in the modal and click Save.
Deleting an annotation
To remove an annotation:
- Find the annotation in the list.
- Click the Delete (trash bin) icon.
- Confirm the action in the dialog that appears.
Permissions
Only project owners and administrators (managers) can create, edit, or delete annotations. View-only members will be able to see the annotations on the charts but cannot modify them.
Help us improve Swetrix
Was this page helpful to you?