Performance Monitoring
The Performance tab gives you deep insights into your website's speed and user experience metrics. By monitoring these metrics, you can identify bottlenecks and optimize your site for faster load times.
Overview
The dashboard provides a high-level view of your website's performance across different metrics.
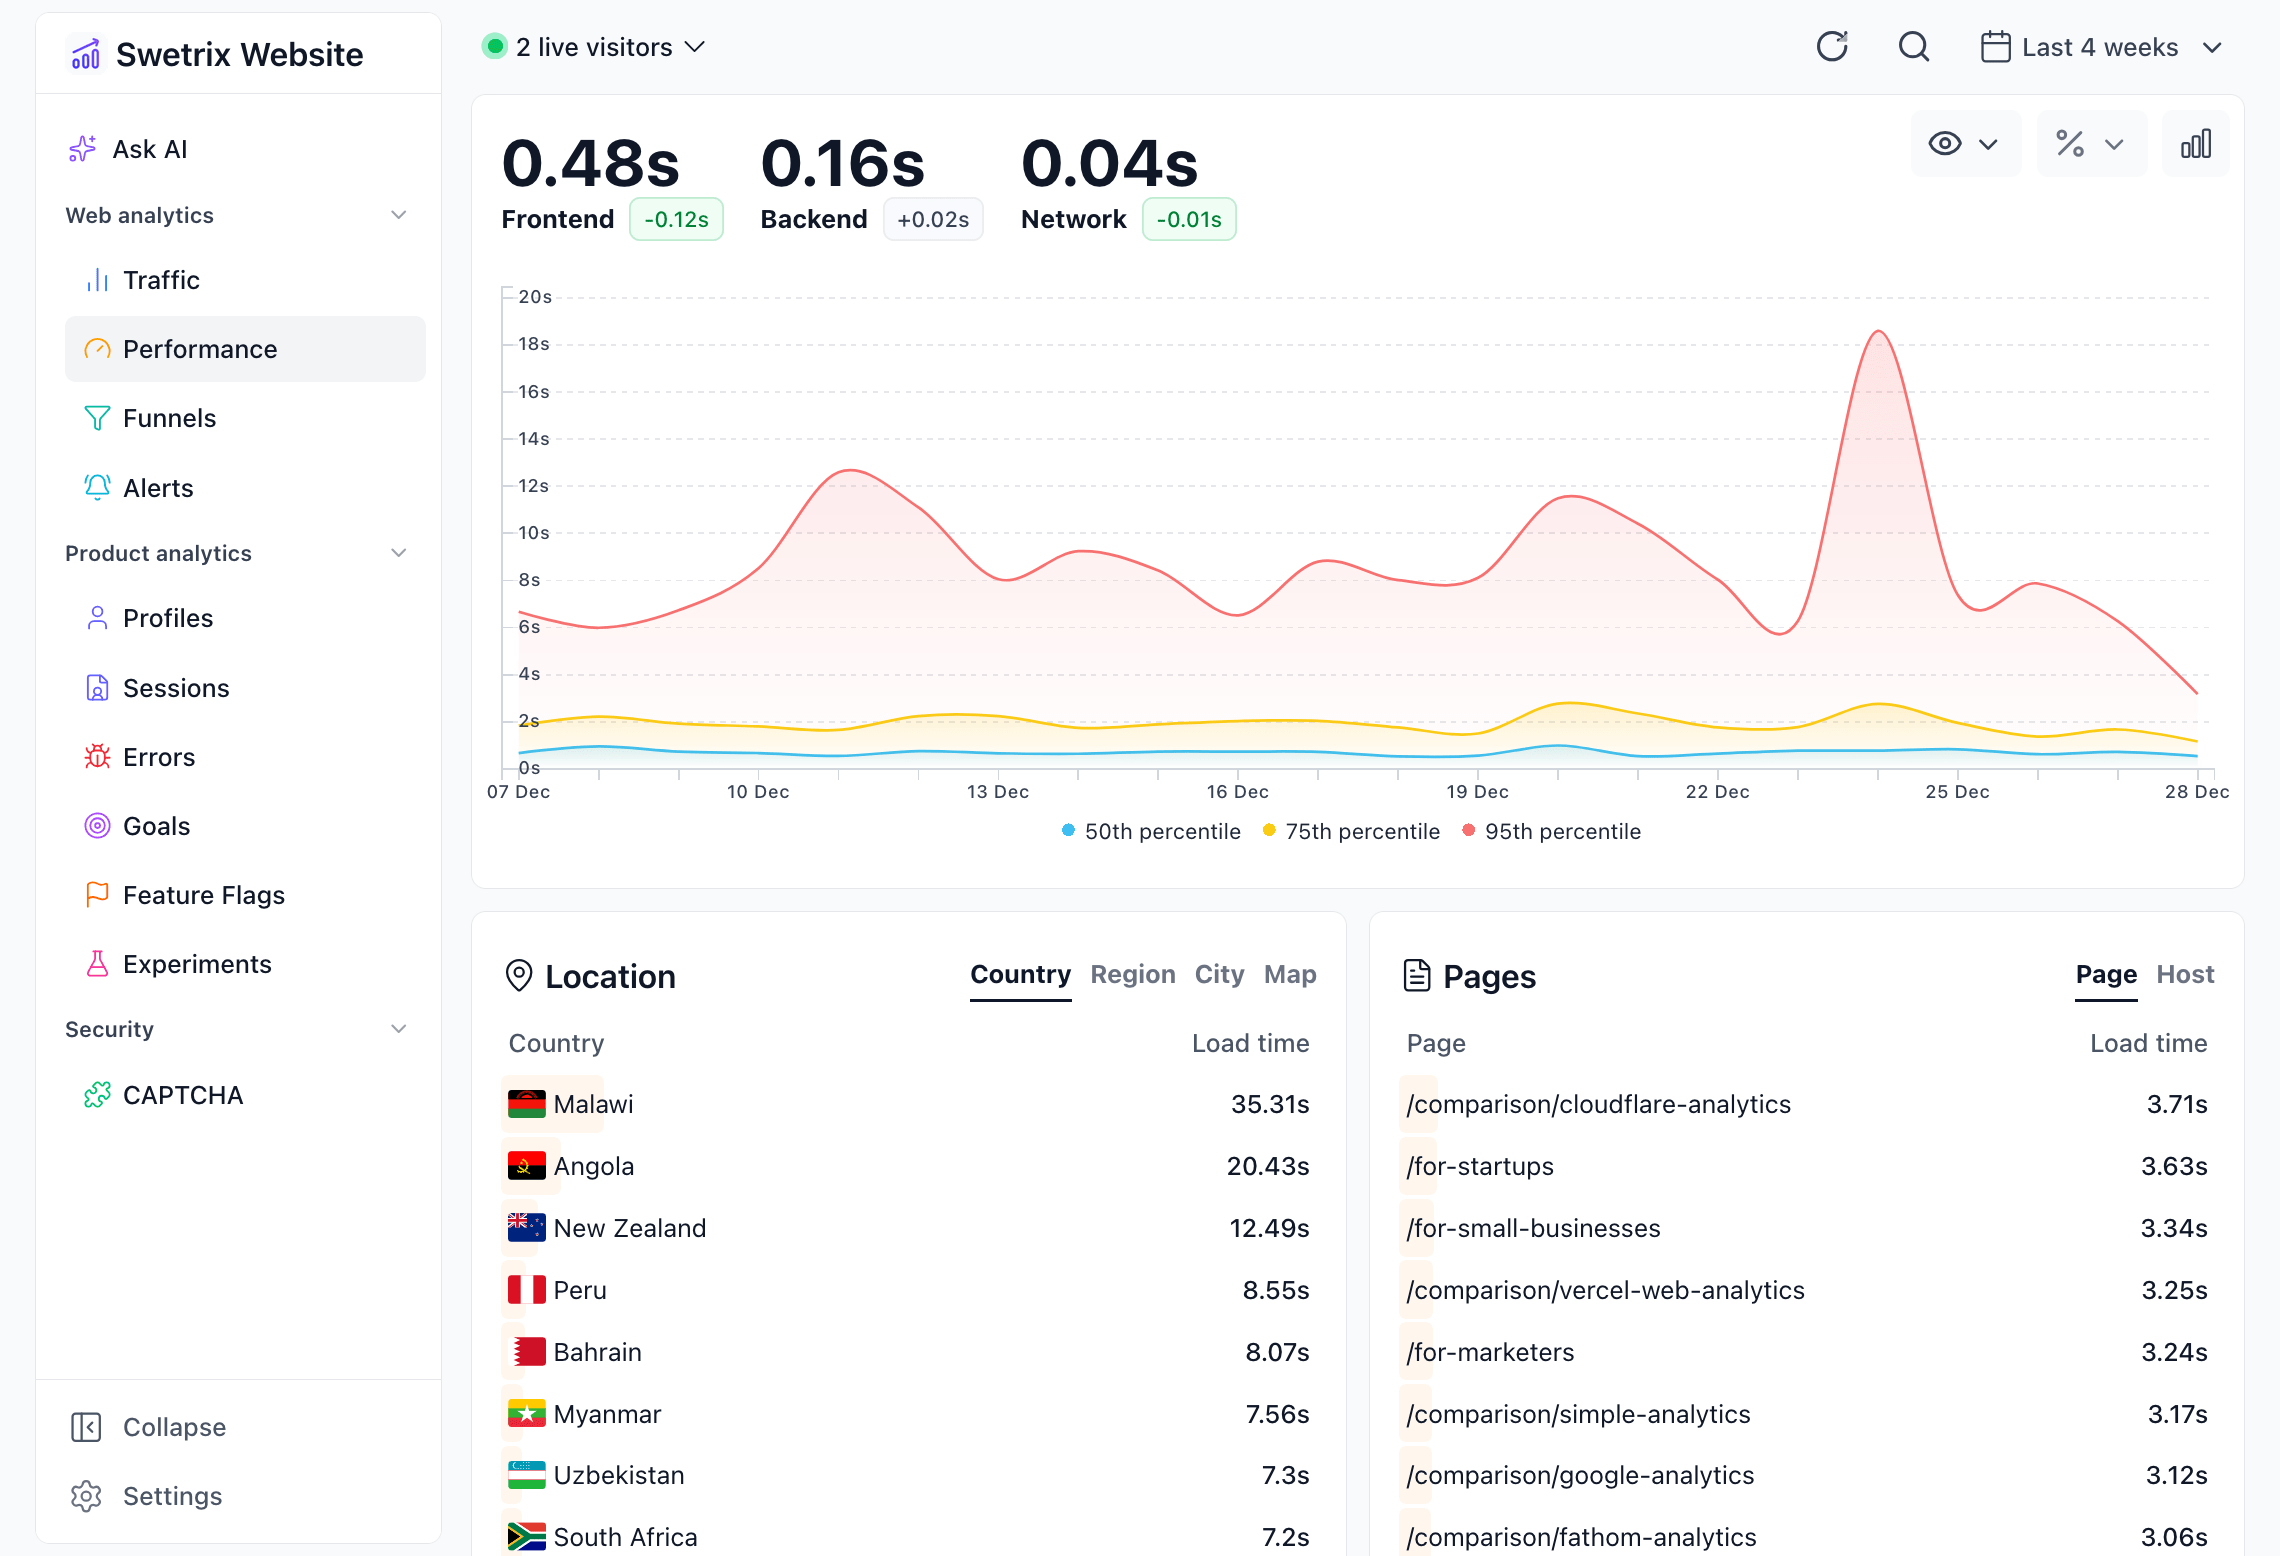
Key Metrics
You can toggle between different metrics to visualize them on the main chart:
- Allocation: Visualizes how much time is spent in different loading phases (DNS, TLS, Response, etc.) relative to the total load time.
- Timing (Full): The total time taken for the page to become fully usable.
- Timing: Provides a breakdown of specific timing components:
- DNS: Domain Name System lookup time.
- TLS: Transport Layer Security handshake time.
- Conn: Connection establishment time.
- Response: Time to First Byte (TTFB) + download time.
- Render: Time spent rendering the page.
- DOM Load: Time until the DOM is fully loaded.
- TTFB: Time To First Byte - time between the request and the first byte of response.
- Network: Focuses specifically on network-related delays.
- Frontend: Time spent on client-side processing and rendering.
- Backend: Time spent on server-side processing.
Aggregation Methods
You can analyze these metrics using different statistical aggregations to understand the distribution of performance:
- 95th Percentile (p95): The value below which 95% of observations fall. This is excellent for identifying outliers and understanding the experience of the slowest 5% of your requests.
- 75th Percentile (p75): The value below which 75% of observations fall.
- Median (p50): The middle value. Half of your users experience a faster load time, and half experience a slower one.
- Average: The arithmetic mean of all recorded values.
Breakdown Panels
Below the main chart, the data is broken down by various dimensions to help you pinpoint where performance issues might be occurring.
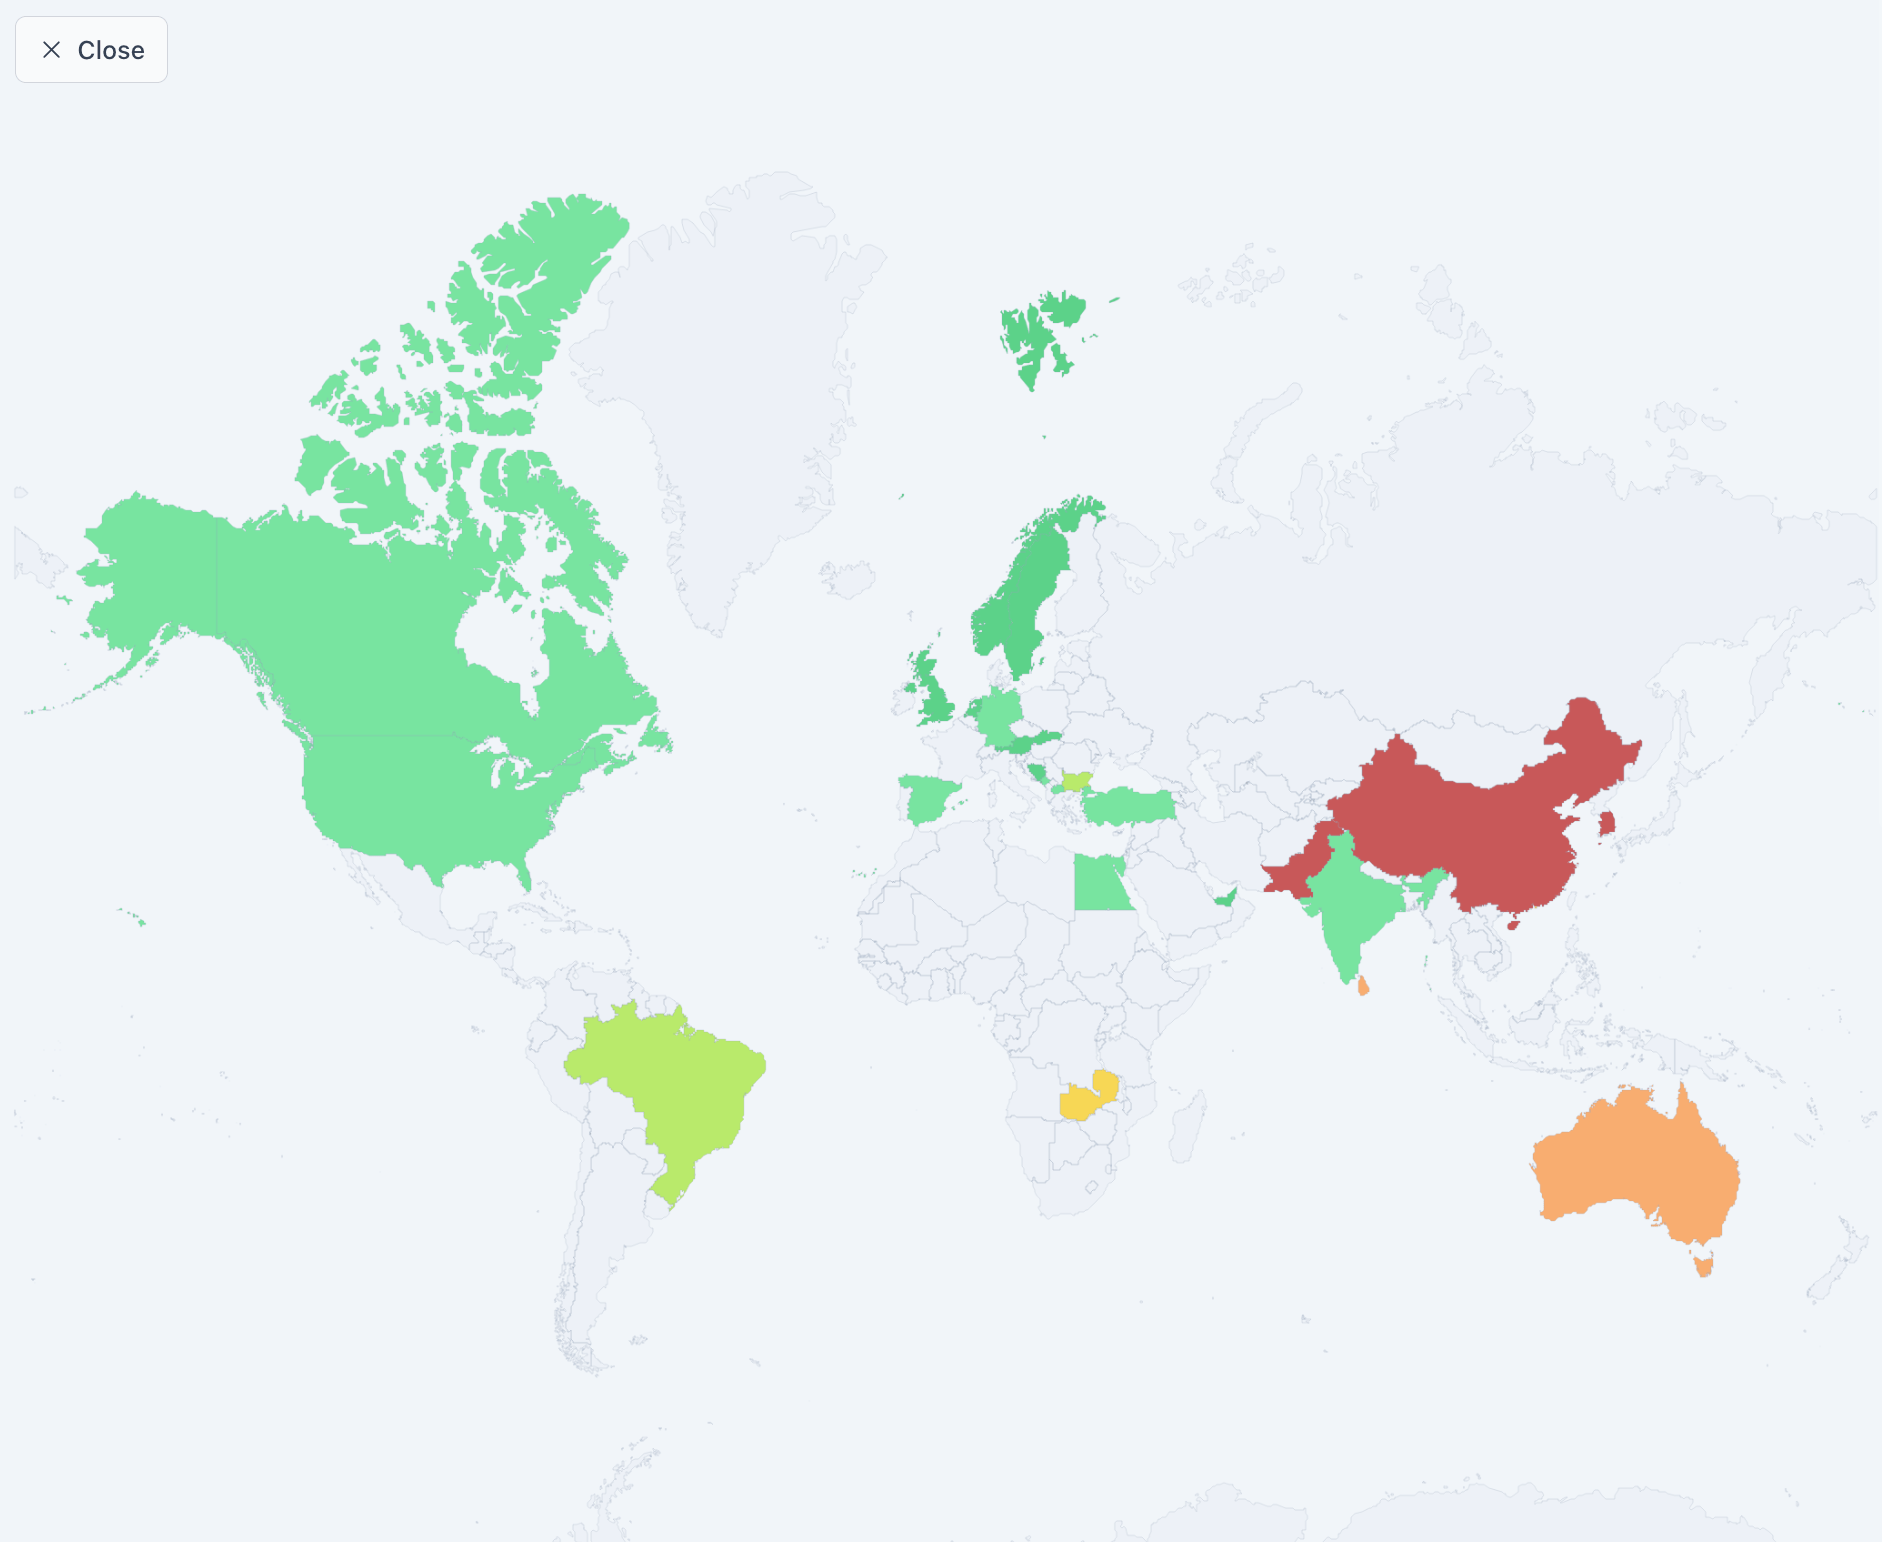
Location
Understand how performance varies by geography. This helps identify if users in specific regions are facing latency issues.
- Countries (CC): Performance metrics per country.
- Regions (RG): Performance by specific regions within countries.
- Cities (CT): City-level performance data.
- Map: A visual heatmap of global performance.
Devices
Analyze performance across different user environments.
- Browser: Compare load times across Chrome, Firefox, Safari, etc. Use this to catch browser-specific performance regressions.
- Device: Compare Desktop vs. Mobile vs. Tablet performance.
Pages
Identify which parts of your site are the slowest.
- Pages: Performance metrics for individual page paths (e.g.,
/pricing,/blog). - Hosts: If you track multiple subdomains or domains, this shows performance per host.
Help us improve Swetrix
Was this page helpful to you?