Error Tracking
Error Tracking allows you to monitor and analyse exceptions that occur in your web application. It helps you identify stability issues, understand their impact on users, and debug them effectively with detailed stack traces and session context.
Setting up
To start collecting errors, you need to integrate the error tracking functionality into your website. You can do this automatically by enabling the global error listener or by manually reporting errors.
Please refer to the Script Reference for detailed installation and usage instructions:
- swetrix.trackErrors(): Automatically captures unhandled exceptions.
- swetrix.trackError(): Manually reports specific errors.
Aggregated Errors View
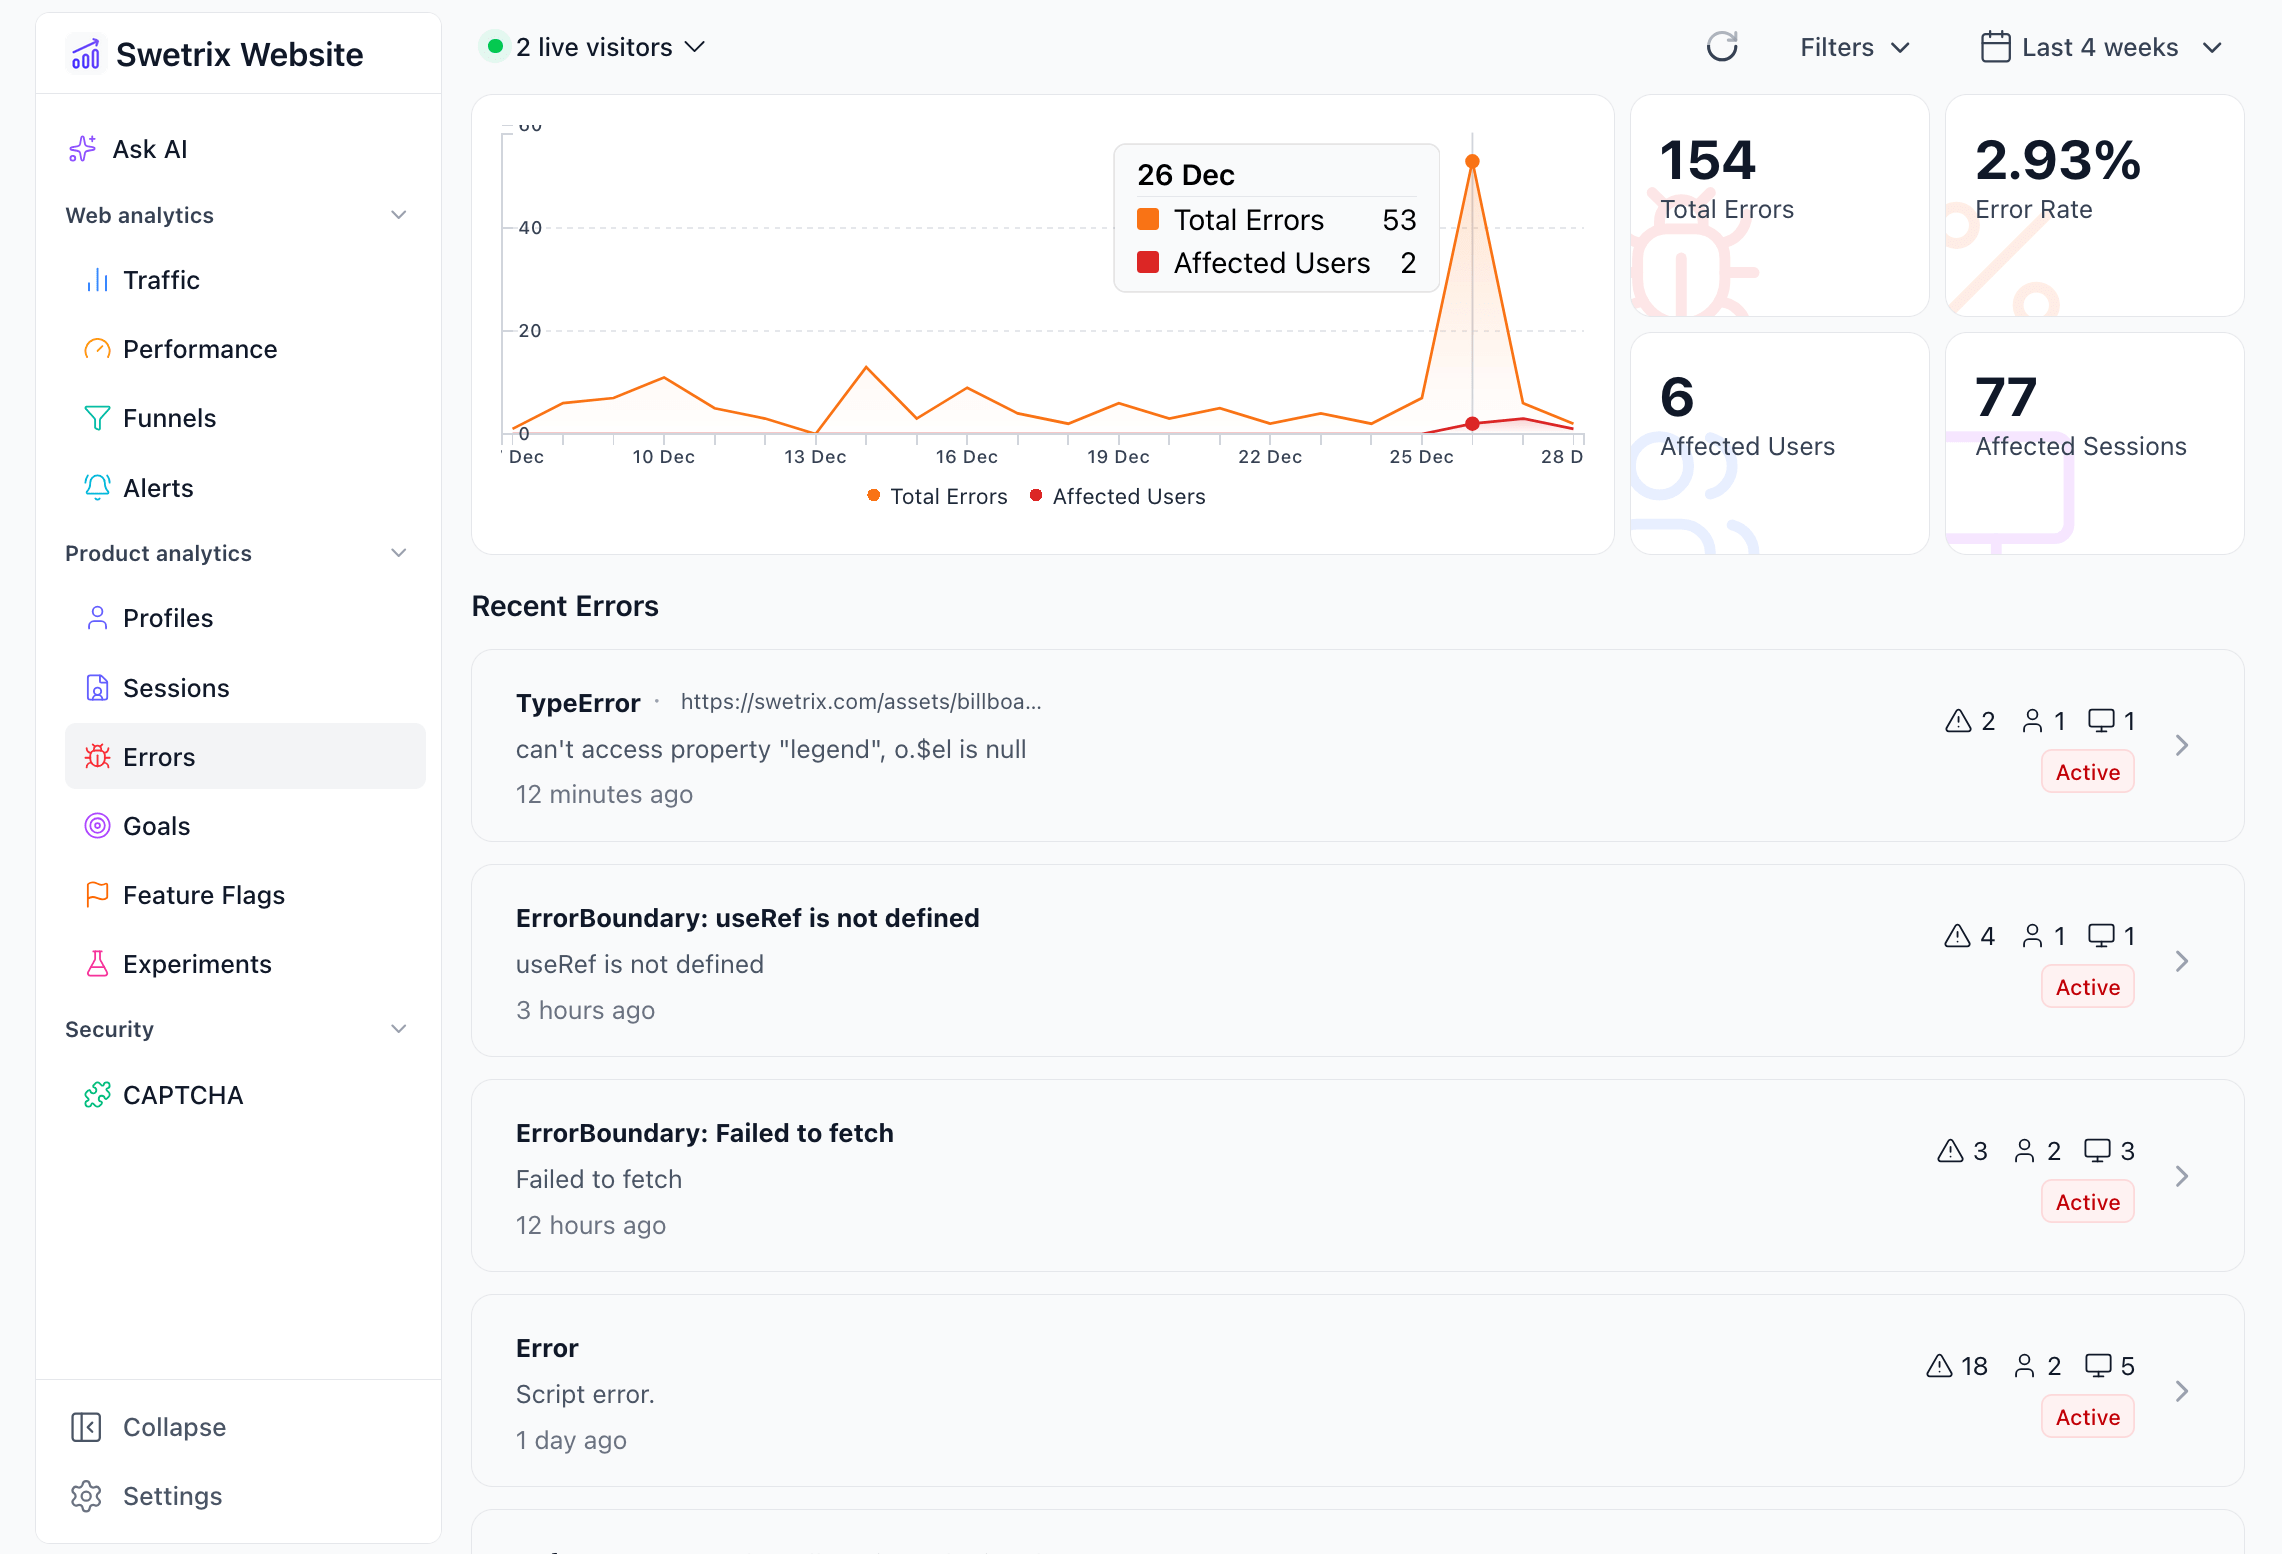
The main Error Tracking dashboard provides a high-level overview of your application's health.
Summary Metrics
At the top of the page, you will find key statistics for the selected time period:
- Total Errors: The total number of error events recorded.
- Error Rate: The percentage of sessions that experienced at least one error.
- Affected Users: The number of unique visitors who experienced an error.
- Affected Sessions: The total number of sessions where an error occurred.
Error Chart
A chart visualises the trend of error occurrences and affected users over time. This helps you spot spikes caused by new deployments or specific incidents.
Recent Errors List
Below the chart is a list of all error groups. Errors are grouped by their name and signature so you can see which issues are most prevalent.
Each item in the list displays:
- Error Name & Message: A brief description of the error (hover for full message).
- Filename: The file where the error originated.
- Status: The current state of the error (Active, Regressed, or Resolved).
- Impact: The number of occurrences, affected users, and affected sessions.
- Last Seen: When the error most recently occurred.
You can filter this list to show Resolved errors by using the "Filters" dropdown.
Error Details
Clicking on any error in the list opens the Error Details view. This page provides deep insights into a specific issue to help you debug it.
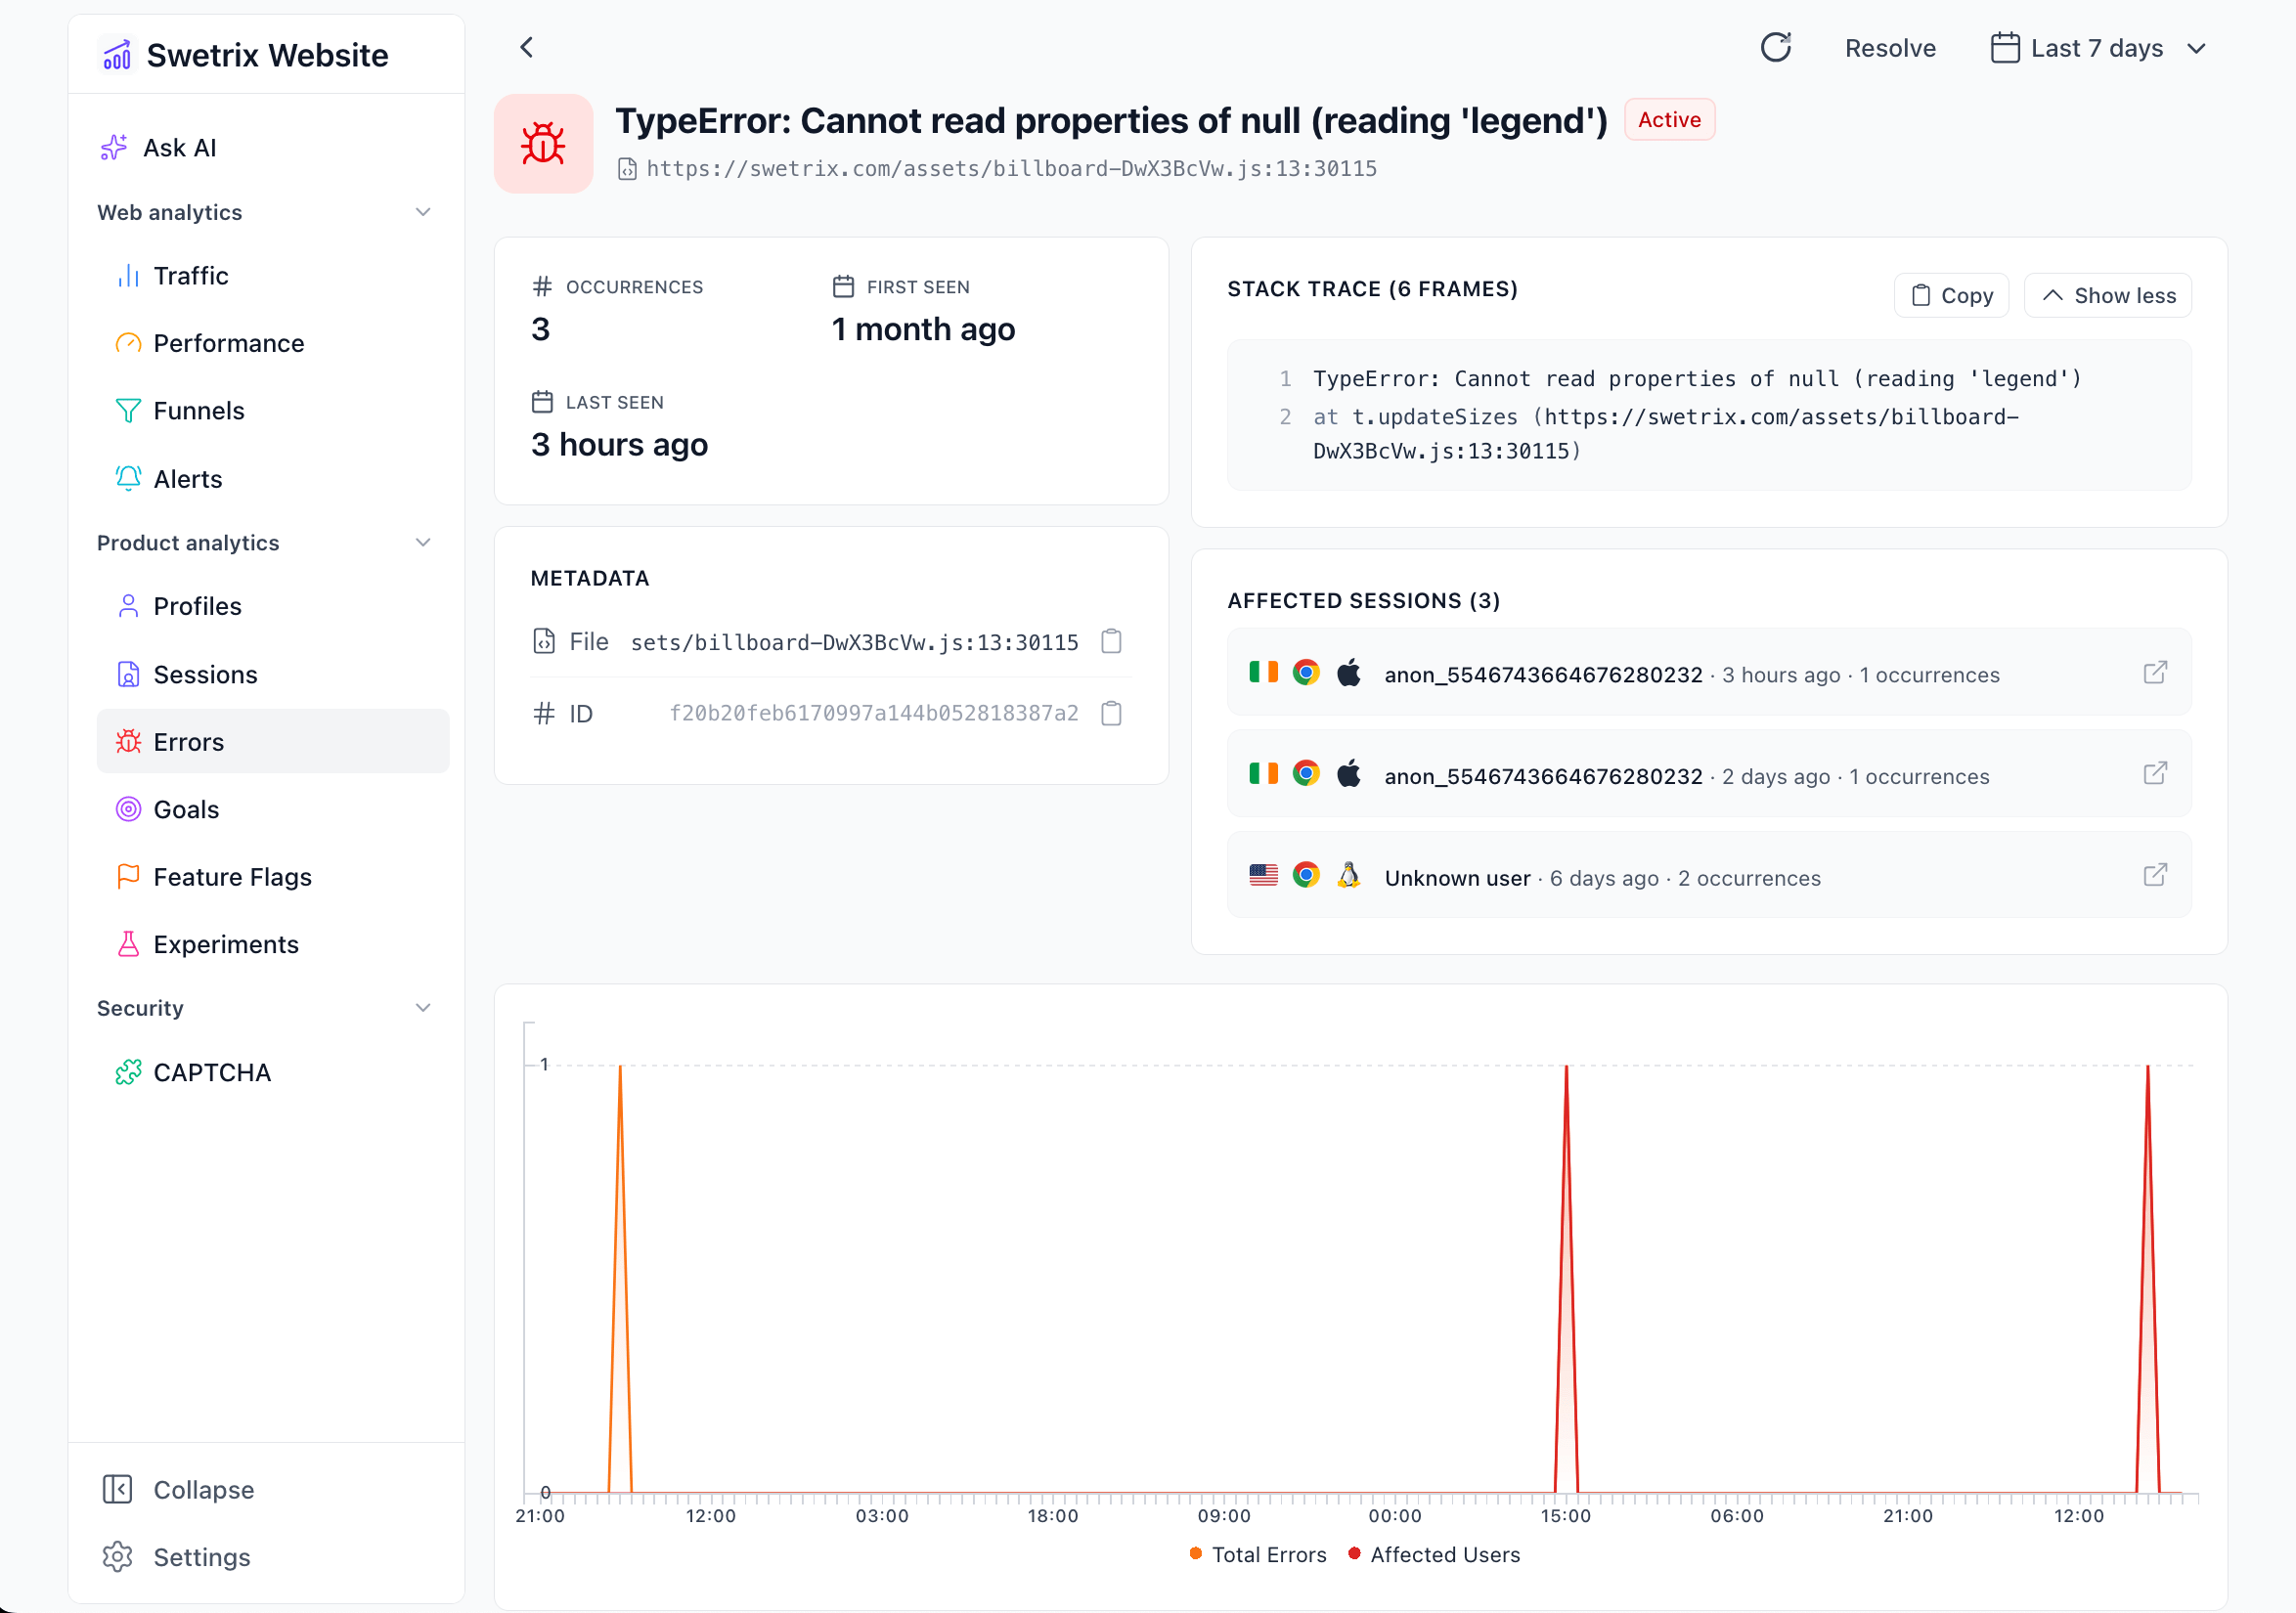
Error Context
- Stack Trace: A fully formatted stack trace showing the exact sequence of function calls that led to the error. You can expand it to see more frames or copy it to your clipboard.
- Metadata: Technical details including the exact filename, line number, column number, and the unique Error ID.
- First & Last Seen: Timestamps indicating when this error first appeared and when it was last recorded.
Affected Sessions
This section lists individual user sessions where this specific error occurred.
- You can see the user's country, browser, and operating system.
- Clicking on a session redirects you to the specific Session Replay or session details, allowing you to see the user's journey leading up to the crash.
Segmentation & Breakdown
To help you reproduce the issue, Swetrix breaks down the error data by various dimensions:
- Location: See which countries, regions, or cities are most affected.
- Devices: Analyse if the error is specific to a browser (e.g., Chrome vs. Safari), operating system (e.g., iOS vs. Android), or device type (Mobile vs. Desktop).
- You can drill down into specific browser or OS versions (e.g., Chrome 114 vs Chrome 115).
- Pages: Identify which pages or hostnames trigger the error most frequently.
- Custom Metadata: If you provided custom metadata (via the
metaobject intrackError), it will be displayed here.
Managing Errors
You can manage the lifecycle of an error to keep your dashboard clean:
- Resolve: Mark an error as "Resolved" when you have fixed it. It will be hidden from the default "Active" list.
- Regressed: If a resolved error occurs again, Swetrix may automatically mark it as "Regressed" to alert you that the fix didn't work or the issue has reappeared.
- Active: The default state for new errors.
To change an error's status, use the Resolve or Mark as active buttons in the top right corner of the Error Details view.
Real-time Alerts
You don't have to constantly check the dashboard to stay on top of issues. You can set up automated alerts to notify you via Email, Slack, Discord, or Telegram when:
- New errors are detected (useful for catching regressions after a deployment).
- The total number of errors exceeds a certain threshold.
Learn more about setting up these notifications in the Alerts documentation.
Help us improve Swetrix
Was this page helpful to you?