Traffic Analytics
The Traffic Analytics dashboard is the core of Swetrix, providing comprehensive insights into your website's visitors, their behavior, and traffic sources. It allows you to visualize data through interactive charts and detailed breakdowns.
Overview
The Traffic view consolidates all essential metrics into a single, easy-to-read interface. You can track visitor trends, analyze specific segments, and drill down into detailed reports.
Key Metrics
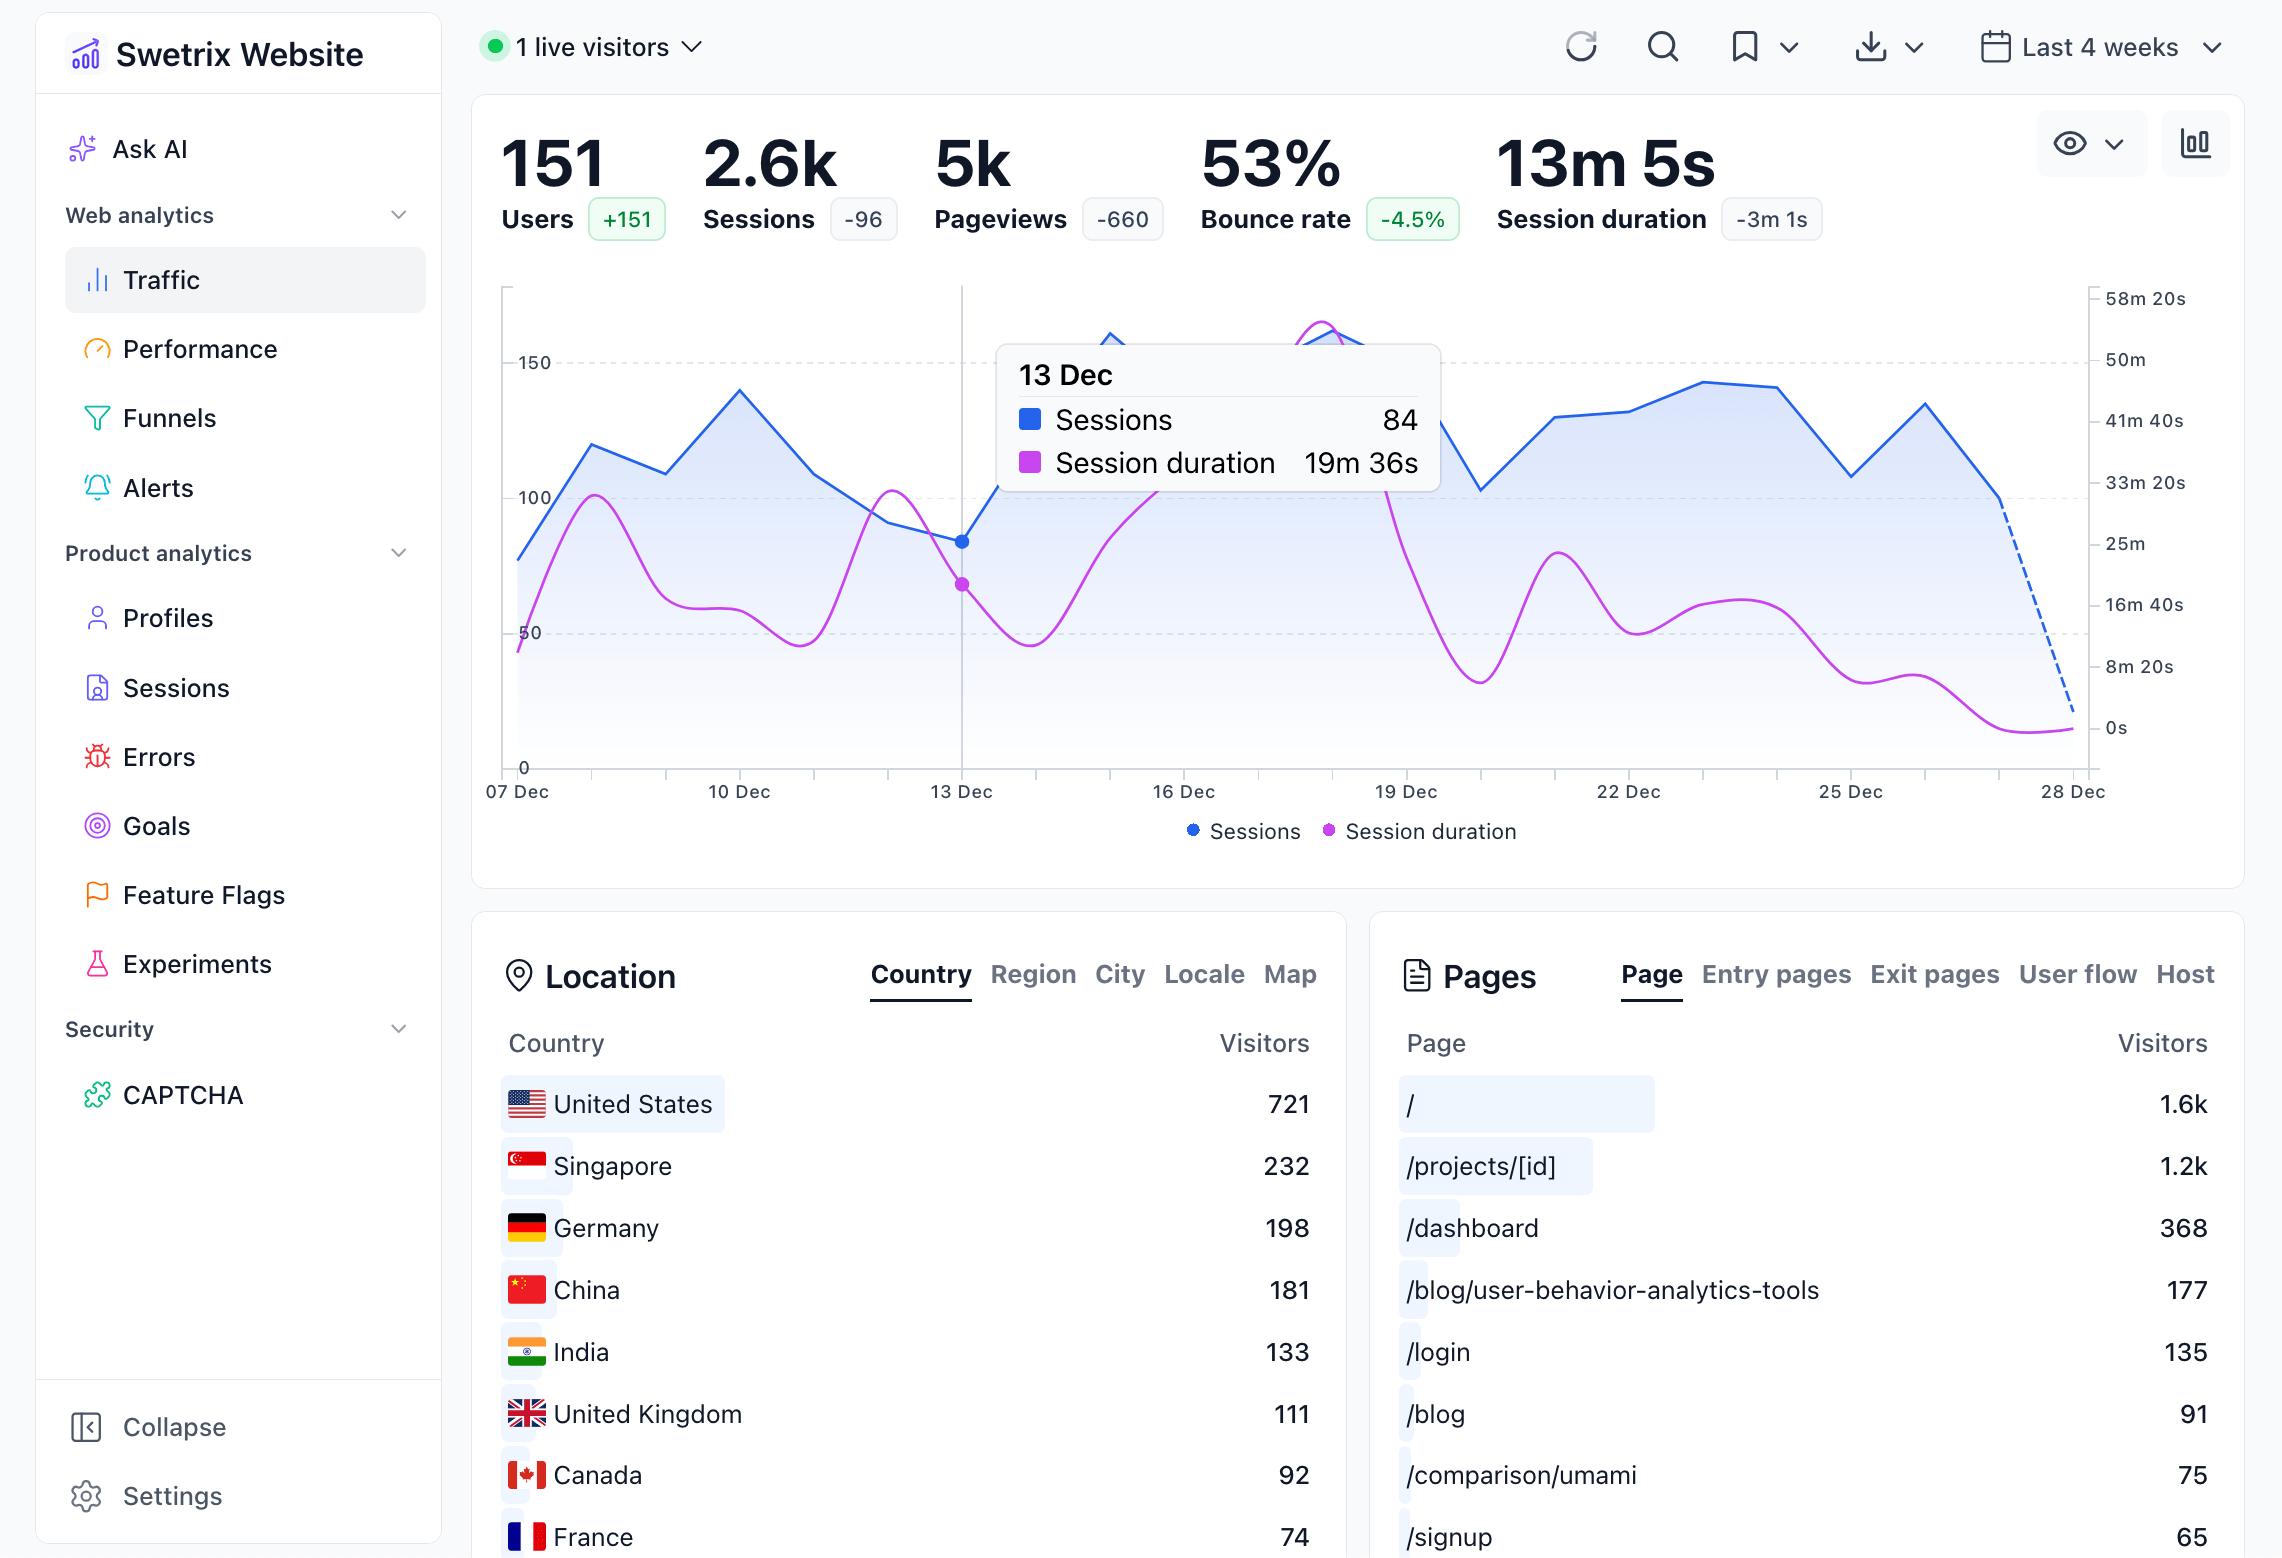
The main chart visualizes various metrics to help you understand your traffic performance:
- Sessions (Unique): The number of unique visitors to your site within the selected timeframe.
- Pageviews: The total number of pages viewed.
- Session Duration: The average time visitors spend on your site per session.
- Bounce Rate: The percentage of visitors who navigate away from the site after viewing only one page.
- Views per Unique: The average number of pages viewed by a single unique visitor.
- Revenue: Total revenue generated (if revenue tracking is enabled).
You can also enable Trendlines to see the general direction of your data and Cumulative Mode to view data accumulation over time.
Traffic Breakdown
Below the main chart, you will find detailed panels categorizing your traffic data:
Location
Analyze where your visitors are coming from. You can view data by:
- Country code & Name
- Region
- City
- Language
- Map View: An interactive map visualizing visitor distribution.
Devices
Understand the technology your visitors are using:
- Browser
- Operating System (OS)
- Device Type (Desktop, Mobile, Tablet, etc.)
Pages
See which parts of your website are most popular:
- Page Paths: The specific URLs visited.
- Entry Pages: The first page visitors land on.
- Exit Pages: The last page visitors view before leaving.
- User Flow: Visualize the path users take through your site.
- Host: Useful for cross-domain tracking, showing which specific domain or subdomain the traffic originated from.
Traffic Sources
Identify how visitors find your website:
- Referrers: External websites linking to yours.
- Source / Medium: Detailed breakdown of acquisition channels (e.g.,
google / organic,newsletter / email). - Campaigns: Track specific marketing campaigns via UTM parameters.
tip
Use our free UTM Generator to easily build trackable URLs for your campaigns.
- Keywords: If you have connected Google Search Console, this tab shows the search queries driving traffic to your site.
Custom Events & Metadata
Swetrix allows you to track specific interactions beyond standard pageviews.
- Custom Events: A dedicated panel shows the performance of your tracked events (e.g., "Button Clicked", "Form Submitted").
- Metadata: You can view detailed breakdowns of metadata attached to both Pageviews and Custom Events in their respective panels.
Timeframes & Comparisons
You can analyze data over various periods using the time selector in the top right corner:
- Standard Periods: Today, Yesterday, Last 7 days, Last 30 days, Month to Date, etc.
- Custom Range: Select specific start and end dates.
- Time Buckets: Group chart data by Hour, Day, Week, Month, or Year for better trend analysis.
You can also Compare the current period with a previous one (e.g., "Previous period" or "Same period last year") to identify growth or decline.
Segments (Saved Views)
You can save specific filter configurations as Segments to quickly access them later. This is useful for frequently analyzing specific user groups, such as "Mobile Users from US" or "Paid Traffic".
Annotations
Annotations allow you to mark significant events directly on your chart, such as a new feature launch or a marketing campaign.
To create an annotation, simply right-click on a data point on the chart and select "Add annotation".
Exporting Data
You can export the current view's data (including the chart and all breakdown tables) to a CSV file for offline analysis or reporting. Click the Export icon (download symbol) in the header actions area.
Help us improve Swetrix
Was this page helpful to you?